Understanding Your Dashboard
The Analytics page gives you a bird’s-eye view of your entire tool collection.
Summary Cards
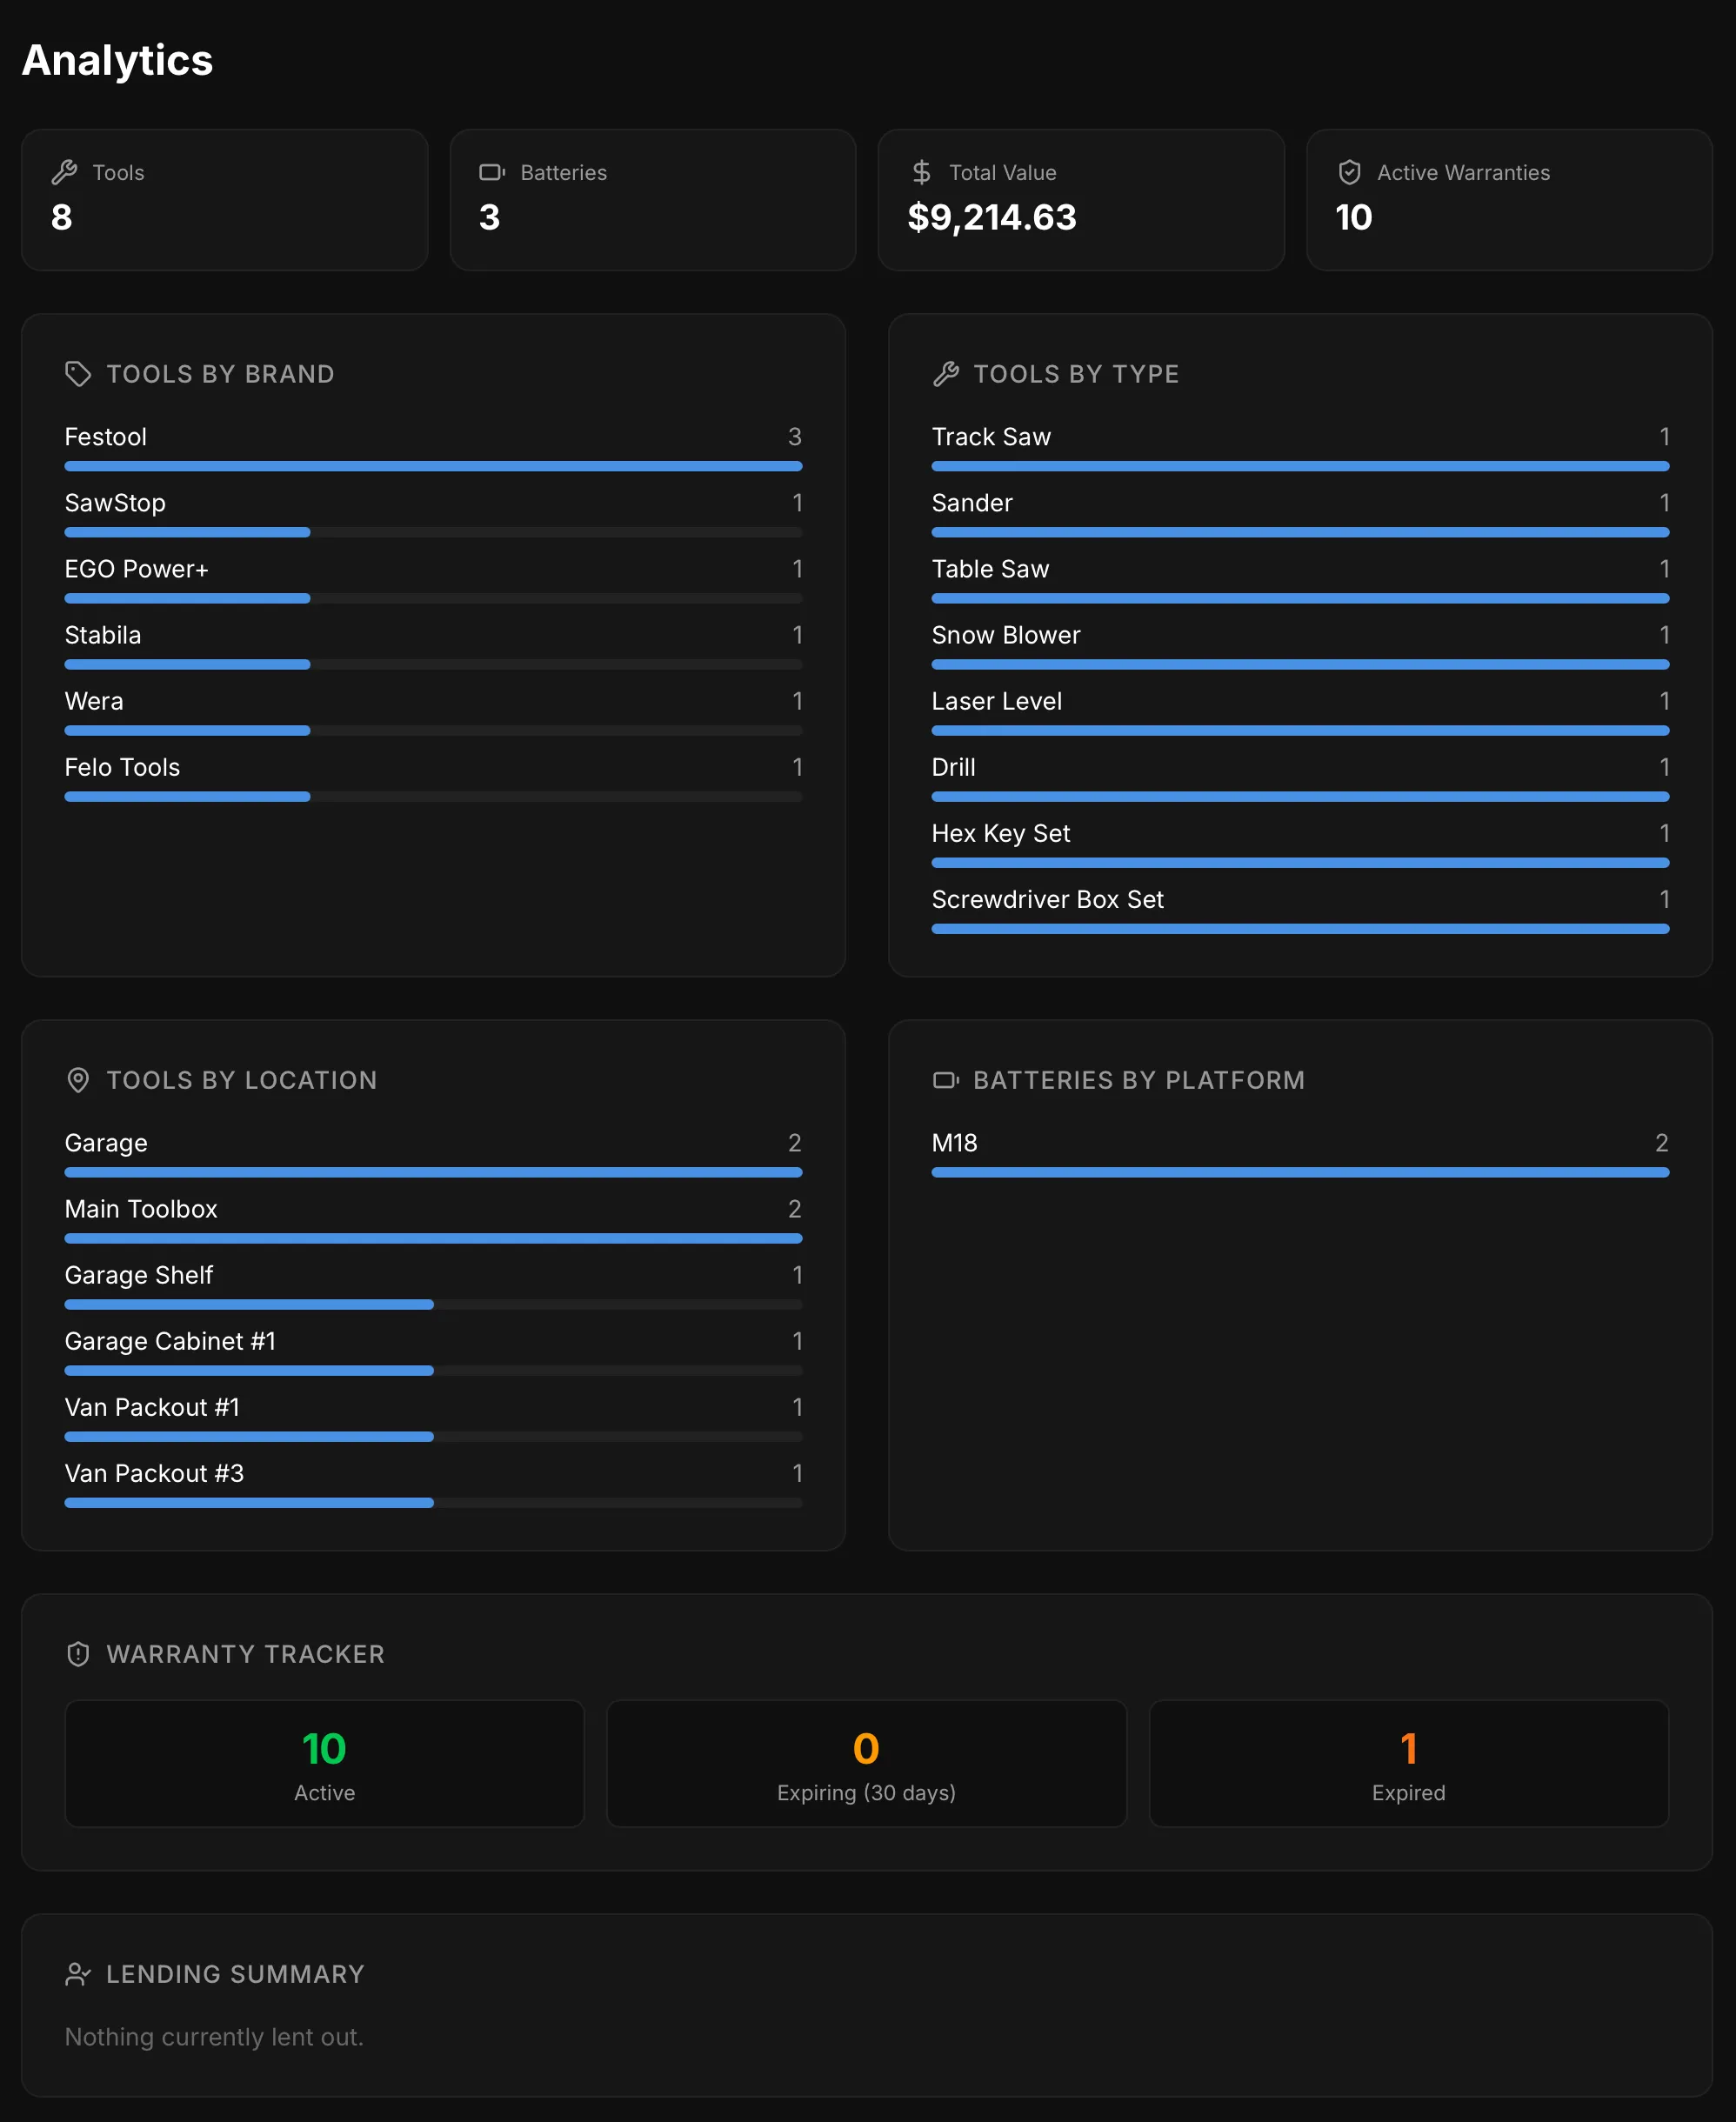
Section titled “Summary Cards”At the top, four cards show:
- Tools — total number of tools in your collection
- Batteries — total battery packs tracked
- Total Value — combined purchase prices of all items
- Active Warranties — number of warranties still in effect
Collection Breakdowns
Section titled “Collection Breakdowns”Interactive bar charts show your collection broken down by:
- Tools by Brand — which brands you own the most of
- Tools by Type — distribution across tool types
- Tools by Location — where your tools are stored
- Batteries by Platform — battery systems in your collection
Warranty Tracker
Section titled “Warranty Tracker”Shows counts for:
- Active — warranties still in effect (green)
- Expiring — warranties expiring within 30 days (amber)
- Expired — past warranty expiration (red)
Tools expiring soon are listed by name with their expiry date.
Lending Summary
Section titled “Lending Summary”Shows all tools and batteries currently lent out, organized by person. Includes how many days each item has been out — items over 30 days are highlighted as a reminder.
Purchase Insights
Section titled “Purchase Insights”A spending chart shows your monthly spending over time. Below it, breakdowns show your top spending by brand and by retailer.